
Have you ever wondered how your local government spends public funds? Whether there are areas of the city that receive more funds than others? If a considerable share of the budget is directed to policies or initiatives that are in the interests of most constituents? These may be hard questions to answer, but understanding how local governments allocate public resources matters. Therefore knowing how they spend public resources is crucial for assessing the quality of democracy and the responsiveness of elected officials to citizens’ interests. One way to approach this topic is by examining local government finances.


In our work in the IDP research group, we have come to use this type of administrative data more and more, a journey that is as exciting as it is arduous. To identify and articulate some of these challenges, organize and refer to valuable existing resources that can shed light into this topic, as well as to share our own insights and strategies, we inaugurate with this post a new collection of blog publications: the Local Spending Series.
We hope that our series proves to be a valuable resource not just to researchers – like us – who are venturing into the world of local government finances, but also to others – such as journalists, social activists, community representatives, students, concerned citizens – who for various reasons would like to know more about how local governments allocate public resources in different democracies.
Why does resource allocation by local governments matter, and how can we know more about it?
At the local level, governments are closest to the everyday lives of citizens. Local governments are often responsible for providing services which matter greatly to the day-to-day lives of many people (as illustrated by Figures 1a-c), such as: maintaining and improving roads, sidewalks and street lighting; collecting trash and managing recycling programs; managing parks and recreational facilities; and in some countries even providing healthcare and education at the most basic levels. Even when local governments are not the main responsible authorities for the provision of public goods and services, they are still in a strategic position to tailor state or national level policies to local needs. As such, the impact of local governments extends even beyond the provision of important services; it has the potential to shape citizens’ perceptions of public sector effectiveness and democratic accountability.
Local governments’ financial information can serve as a rich data source to assess the quality of democracy. Financial activities are actions and transactions encompassing how money and financial assets are raised, and handled. We narrow our attention to a specific subset of government financial activities, specifically those related to how local governments spend public resources. By examining how local governments allocate resources, we can have a glimpse on whether elected officials are responsive to the needs and concerns of their constituents. Financial information can reveal local policy priorities. If a significant portion of resources are allocated to local clinics and vaccination programs, it can signal a commitment to public health whereas a heavy emphasis on infrastructure spending might reflect an emphasis on economic development. Analysis of financial data can also serve to identify disparities in resource allocation that may disproportionately affect different communities. That is, local governments may prioritize certain functions which are popular among the constituency in general – such as paving streets – but still favor particular areas of the city with respect to others. Local financial data can also serve as an indicator of governmental efficiency by showing whether budget allocations for specific purposes are utilized and, if so, whether they effectively achieve their intended policy objectives. If a municipality invests heavily in infrastructure development but roads and public transportation remain of poor quality, spending in that area may be considered ineffective. Financial data may also be used to indirectly study corruption, when large amounts of resources are unaccounted for, when prices paid for certain goods seem to be above market value, when certain companies seem to be consistently favored by public contracts.
Different projects of the IDP research group involve knowing whether local governments represent the interests of citizens and benefit certain socioeconomic groups more than others. In one research project, we would like to know more about these processes within Brazilian and South African municipalities, and in another, the focus is on German municipalities. To study these processes, we rely heavily on local government financial data. This can be a rich source of information, but it is also a complex one.
What makes municipal spending information complex?
Diving into the realm of municipal spending information can indeed appear complex. The complexity is primarily due to the specialized terminology and intricate administrative processes inherent to this domain.
We start by addressing the issue of confusing terminology. The term “government spending” is often used as a catch-all term encompassing all information that relates to money the government uses to pay for services and goods. However, “the money the government uses” is actually displayed in different documents, in different ways, and with different levels of concreteness. There are three key processes that relate to government spending: budgets, public procurement, and singular disbursements from governments to others, which are also commonly referred to as “spending”. To avoid confusion between the more generic definition and the more specific one, in this blog series we refer to the latter as singular disbursements. In turn, we refer to the combination of the different processes – budget, procurement, disbursements and other processes that may refer to “the money the government uses” – as government spending. We will address them in more detail in our next post.
Establishing the difference between the terms is relevant as they refer to different but related processes. While budget, public procurement, and singular disbursements can help answer our initial question of ‘where does the money go,’ the answers they provide may differ. Budget documents potentially provide an overview of government expenditures but tend to lack the fine-grained details found in other types of spending data. Singular disbursements are valuable for understanding unique situations but might be more difficult to analyze at a higher level due to their heterogeneity. Conversely, public procurement documents can be a useful source of data because they may aggregate many singular disbursements to fulfill a specific government goal. Still, procurement documents may not provide a complete picture of government spending, as other government activities may not require selecting specialized companies or individual professionals.
Lastly, the inconsistency in how municipal spending information is presented across different sources contributes to the complexity. This may involve levels of detail, but also types and formats of data, which can leave people navigating a mosaic of fragmented information. Some types of spending information may be subjected to similar standards, centralized in national or regional institutions. Others may be more heterogeneous because they are managed at the local level by municipalities themselves, each with its own reporting methods.
To illustrate the complex puzzle of municipal spending information we will use some examples taken from Brazilian and South African municipalities. We have started this blog post by asking ‘where does the money go?’. The answer to that question will be constrained by the way spending information is displayed in the document one is analyzing, and a financial document is the outcome of a given spending process.
We start by looking at budget documents. Government budgeting is a cyclical process involving planning, decision-making, and review of public resource allocation. While this process varies across countries, there are common stages. Different budget documents represent different stages in the budget cycle. Different documents also may use diverse classification systems, influencing the type of spending information disclosed. We illustrate some of these differences by referring to different budget documents in Brazil and South Africa. Figure 2 shows a page of a supporting document of the enacted budget in a South African municipality:
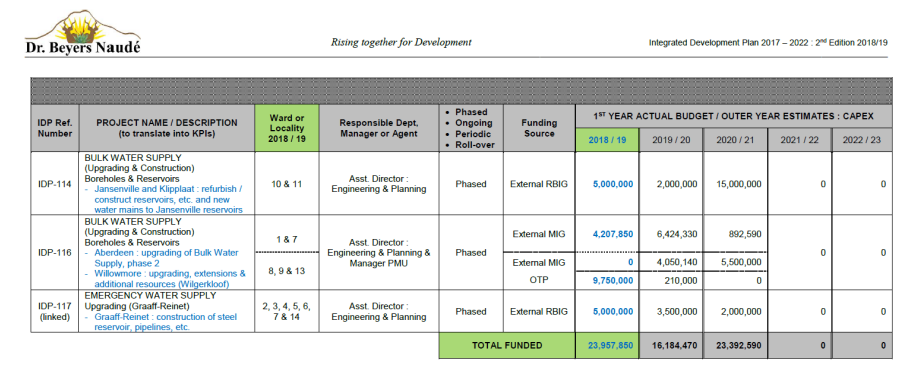
The enacted budget is an executive proposal approved by the legislative body. It serves as a framework for the government, through its various departments and agencies, to go about their activities. Does this document help us answer the question of “where does the money go?”. Yes, but only to some extent. The table displayed in Figure 2 lists, among other things, project names and their values, but also the locality of the project, by indicating in which ward it is located. Still, it only provides the location of capital expenditures, that is, investments in long-term assets. It does not tell us much about the geographical destination of operating expenditures, that is expenses associated with routine operation, such as salaries or social assistance benefits.
The spending information that Figure 2 contains also may vary in terms of concreteness. The amounts listed in the columns to the right indicate the actual budget and outer year estimates. This means that the information displayed for some years refers to “planned” allocation instead of ”realized” spending. This is because the enacted budget tends to represent the earlier phases of the budget cycle in South Africa.
In Figure 3 we display another type of budget document , referring to a latter stage in the budget cycle, taken from a municipality in Brazil:
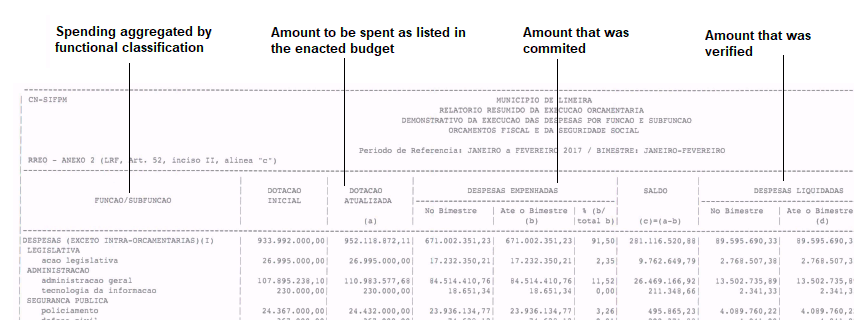
Figure 3 shows an in-year report, a budget document providing, among other things, information on values that were actually disbursed during the fiscal year, and thus can be contrasted with budgeted expectations. Documents referring to later budget phases, such as the one in Figure 3, will tend to be more concrete than those from earlier phases, such as the one in Figure 2.
The other difference between the documents displayed in Figures 2 and 3 has to do with standardization. The way the in-year report is displayed is standardized across Brazilian municipalities, as they have to transmit this information using a platform managed by the national treasury. As a central financial institution, the national treasury consolidates and monitors the financial activities of municipalities. Some centralization of such documents in that way is present in other countries. The centralization of information ensures a consistent and reliable source of financial information allowing comparisons between different municipalities. In South Africa it is also possible to find the supporting documents to the enacted budget in the website of the national treasury. However, they are not transmitted through a centralized platform, but rather produced in pdf format by different municipalities and uploaded to the centralized repository, leading to more heterogeneity.
And where does the money go according to Figure 3? The first column classifies spending according to function/subfunction, that is, the policy goals the money is directed at, such as public safety or general administration. The other columns also refer to the level of concreteness of spending: first, the amount allocated in the budget, then the amount that was committed, and then the amount verified. As we will also see in our second blog post in this series, these three terms refer to different stages of disbursing public money, with the actual disbursement taking place in the end.
If one wants to know about the geographical location of spending in Brazilian municipalities, one would have to perhaps resort to other types of spending data1. Although in the last years, there has been a push for more financial transparency in municipalities, non-budgetary spending data in Brazil still tends to be reported in a heterogeneous way across municipalities. As is the case, not all spending will be geographically identifiable, and even if it is, it is not a given that it will be reported in such a way. Construction work spending, however, is inherently more prone to geographical identification than other types of spending. Still, it is also true that it is heterogeneous and scattered across different sources.
One way Brazilian municipalities may use to display information about different construction works is via an interactive map on their website, as displayed in Figure 4:
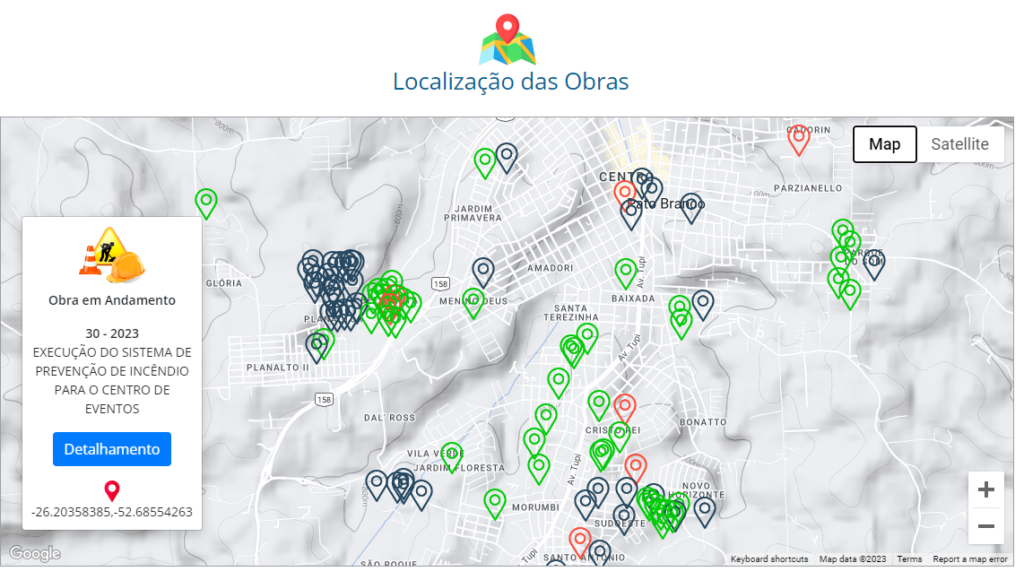
Indeed, maps are an intuitive display of the location of different construction sites – particularly to ordinary citizens -. Maps may not be, however, always readily downloadable and prone to enable a calculation of how much money goes into different areas. To make more systematic assessments about spending in different parts of the city the ideal source of information about construction works would be provided in open data format: a spreadsheet listing different construction works along with details such as who is the responsible contractor, when did the construction work started, how much does it cost, and where it is located. Most commonly, however, it is only possible to get such detailed information about construction works from associated administrative processes: public procurement and single disbursements. Although these are rich sources of information, navigating them may be time-consuming and confusing, especially when one is unaware of how the information comes about. Figure 5 shows how information about construction works is often displayed in a dedicated section of a municipal website:
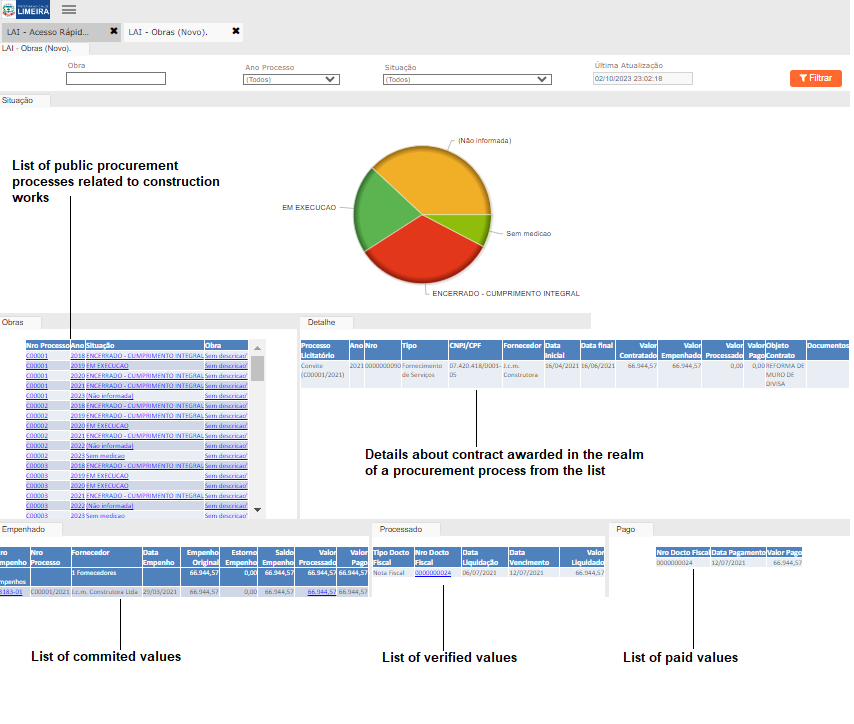
Figure 5 illustrates a well-structured municipal website that is nevertheless much less intuitive in terms of providing a direct and clear answer to ‘where does the money go’ than the two options we previously mentioned. In Figure 5 a list of public procurement processes related to construction works is provided more or less systematically (on the middle left), in a table indicating the number of the specific public procurement process, the year, the current stage. Once one clicks on single procurement processes, the detail window (on the middle right) provides more specific information about the construction work which was hired via the procurement process, including the name of the hired company, the total amount listed on the contract, a description of the work and even a pdf copy of the contract. In the bottom left table, there is a list of committed values within the procurement process, with the last two columns of the table indicating the amount verified and the amount paid. When municipalities only report spending information on their websites in the way displayed in Figure 5, to know in which particular area of the city a given construction work is located one would have to maybe consult the description of the scope of the contract.
So as illustrated in this subsection, municipalities’ official financial information is prone to be presented in various formats, emphasizing different information, arising from different processes, with varying levels of intuitive information being displayed. Budget data may well be the most comprehensive and standardized source of spending information across municipalities in a country. Nevertheless, providing details on the geographic distribution of budget spending appears to be an uncommon practice worldwide2. This means that in many places, to have a sense of ‘where’ the money is spent not only in terms of policy areas but also in terms of geographical areas, one would have to resort to more heterogeneous non-budgetary spending data.
To a considerable extent the logic behind the processes generating government financial data is similar at the national and local levels, but key differences do exist. In more pragmatic terms, there are at least two reasons why using financial data from local governments is more challenging than using financial data from national ones. The first is greater institutional variability and second is the number of local governments.
It is true that local governments exist in most countries, but their administrative structure varies, as does their administrative capacity. Also relevant, the scope of policies under the responsibility of local governments tends to vary. For that reason, comparing local governments across countries can be problematic. In Germany, for instance, local government responsibilities even vary within the country.
Lastly, identifying and collecting data from all local governments in a given country requires considerable effort. While the number of countries in the world does not currently exceed 200, in South Africa alone there are over 250 municipalities. This is not even so much in comparison to certain countries: in Brazil there are over 5,500 municipalities, that is approximately 20 times the number of municipalities in South Africa, and in Germany there are roughly twice as many municipalities as in Brazil, 11,000. For that matter, examining the availability of local governments’ financial data and collecting it across all these units is clearly a highly costly endeavor.
Next steps
In this blog post we have discussed the use of local government financial data to know more about how public resources are allocated within municipalities. We have used Brazilian and South African municipalities as examples to demonstrate the diversity in the presentation of municipal spending data, a trend observed across various countries. In our next post, we will summarize the rationale behind three different processes generating local government financial data: budgeting, public procurement, singular disbursements. We will address key stages and requirements that constitute them, while also attempting to draw attention to the fact that, although these are different processes, they are nevertheless interconnected. We believe attaining a basic familiarity with different administrative processes involved in producing spending information is important. Such a familiarity enables individuals to make informed decisions about which information sources best suit their specific needs and how to look for them. We invite all of those who would like to know more about how local governments allocate their resources to stay tuned for our next post in the Local Spending Series.
References
Fundação Tide Setubal. 2019. “Regionalização do Orçamento em Grandes Cidades”. Available at: https://fundacaotidesetubal.org.br/midia/publicacao_2988.pdf
Open Knowledge Foundation. 2015. “The Open Data Handbook”. Available at:https://opendatahandbook.org/
Notes
- Some initiatives in that regard are found in the city of São Paulo, Brazil. One is an effort to derive geographically identifiable information in terms of spending on municipal staff, health , early-childhood education, and waste collection using different sources of administrative data (see more about it here:
https://observatorio.tcm.sp.gov.br/Regionalizacao ). Another relevant recent initiative aims to encourage São Paulo municipal employees to devise solutions to make the budget information more geographically identifiable it ( see more about it here
https://fundacaotidesetubal.org.br/desafio-gasto-publico-tem-endereco-promove-a-regionalizacao-do-orcamento-na-cidade-de-sao-paulo/). A third initiative is the platform “taking care of my neighbourhood”, which presents a map showing geocoded spending data in different neighbourhoods of the city (https://cuidando.vc/2022/1) ↩︎ - A recent report surveying 26 large cities finds that only one, Buenos Aires, displays 100% of geographically identifiable budget spending. Other large cities display much lower values, such as Berlin and Cape Town, which displayed roughly 30% of budget expenses with geographical information, and São Paulo, which displayed roughly 6% (Fundação Tide Setubal, 2019:22). ↩︎
